


INTRODUCTION
Tuberculosis (TB) is a contagious infection caused by Mycobacterium tuberculosis, primarily affecting the lungs (pulmonary TB) but potentially spreading to other organs (extrapulmonary TB). Symptoms include chronic cough, fever, night sweats, and weight loss. It spreads through airborne droplets when an infected person coughs or sneezes. While treatable with antibiotics, drug-resistant strains are a growing concern. TB remains a global health challenge, especially in low- and middle-income countries. Prevention strategies include the BCG vaccine and early detection/treatment of active cases.
Active TB is a symptomatic and contagious form of the disease, characterized by cough, fever, and weight loss, requiring a 6–9-month antibiotic regimen. In contrast, Latent TB Infection (LTBI) involves dormant bacteria, causing no symptoms or transmission. However, 5-10% of LTBI cases may progress to active TB, particularly in individuals with weakened immunity. LTBI is diagnosed through skin tests or blood assays and managed with preventive therapy to reduce progression risk. Both stages are vital for effective TB control.
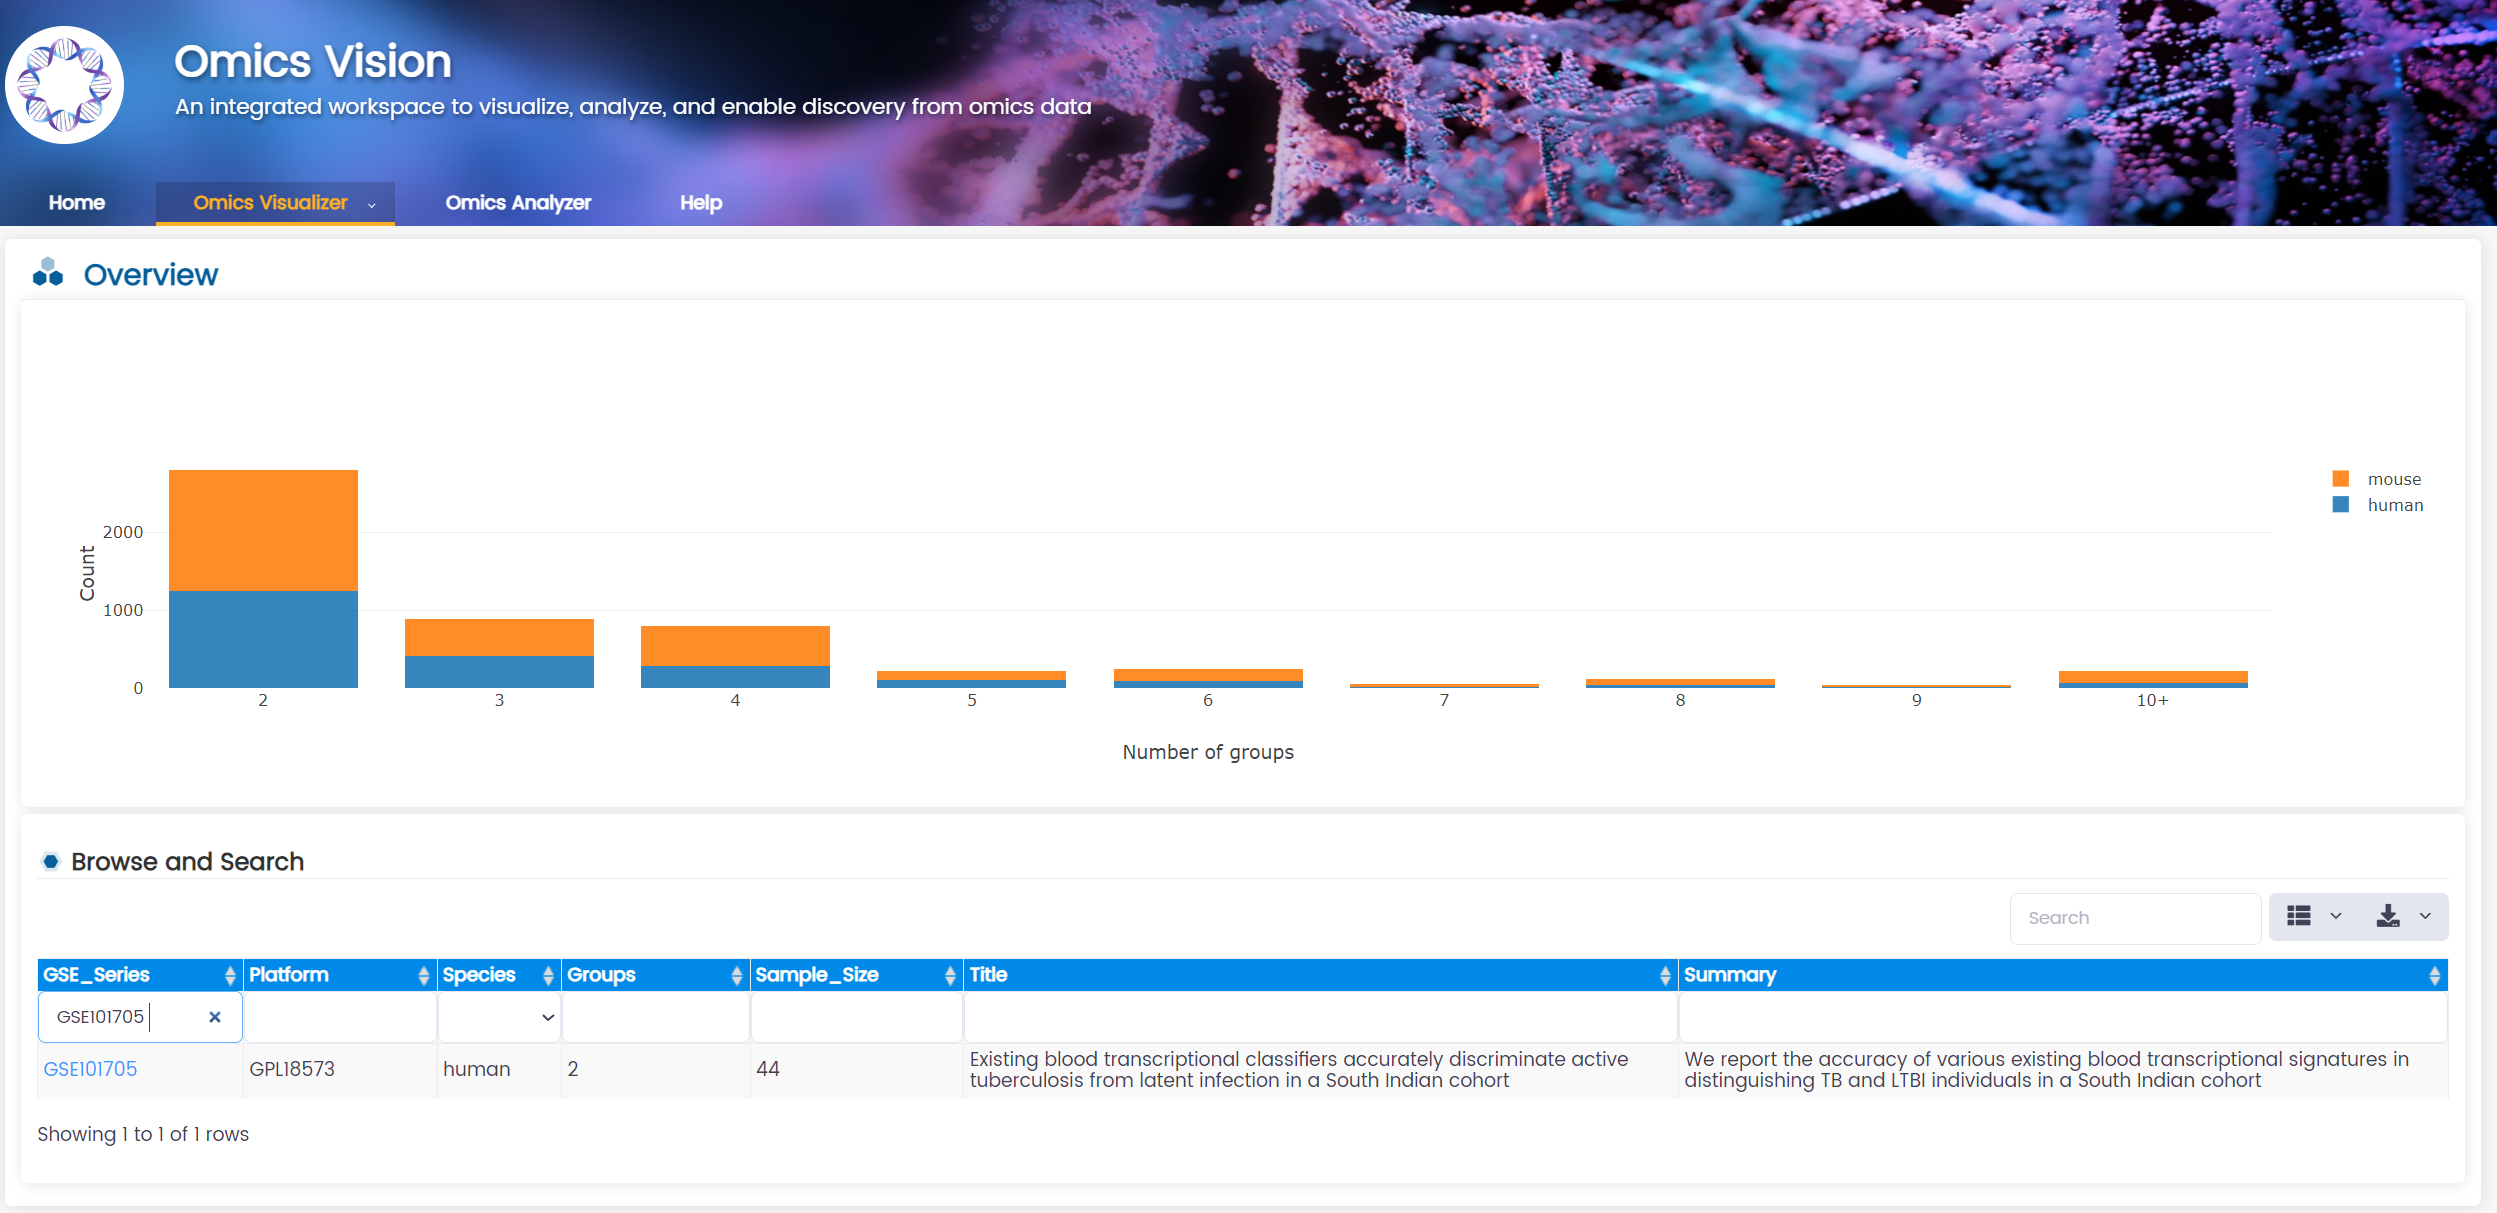
The Gene Expression Omnibus (GEO) dataset GSE101705, published on January 24, 2018, is a publicly available RNA sequencing (RNA-seq) dataset derived from blood samples of a South Indian cohort, focusing on tuberculosis (TB) research. It includes transcriptome profiles of individuals with active TB and latent TB infection (LTBI), aiming to evaluate the accuracy of blood-based transcriptional signatures in distinguishing between these conditions. This dataset has been instrumental in validating TB gene signatures, particularly in studies exploring malnutrition and immune responses, with key findings demonstrating the effectiveness of these classifiers in accurately identifying active TB across diverse populations.
ANALYSIS AND RESULTS
We now show how to use our Bioinformatics Platform to perform the analysis.
1. Search for GSE101705 in Omics Analyzer under module Omics Vision
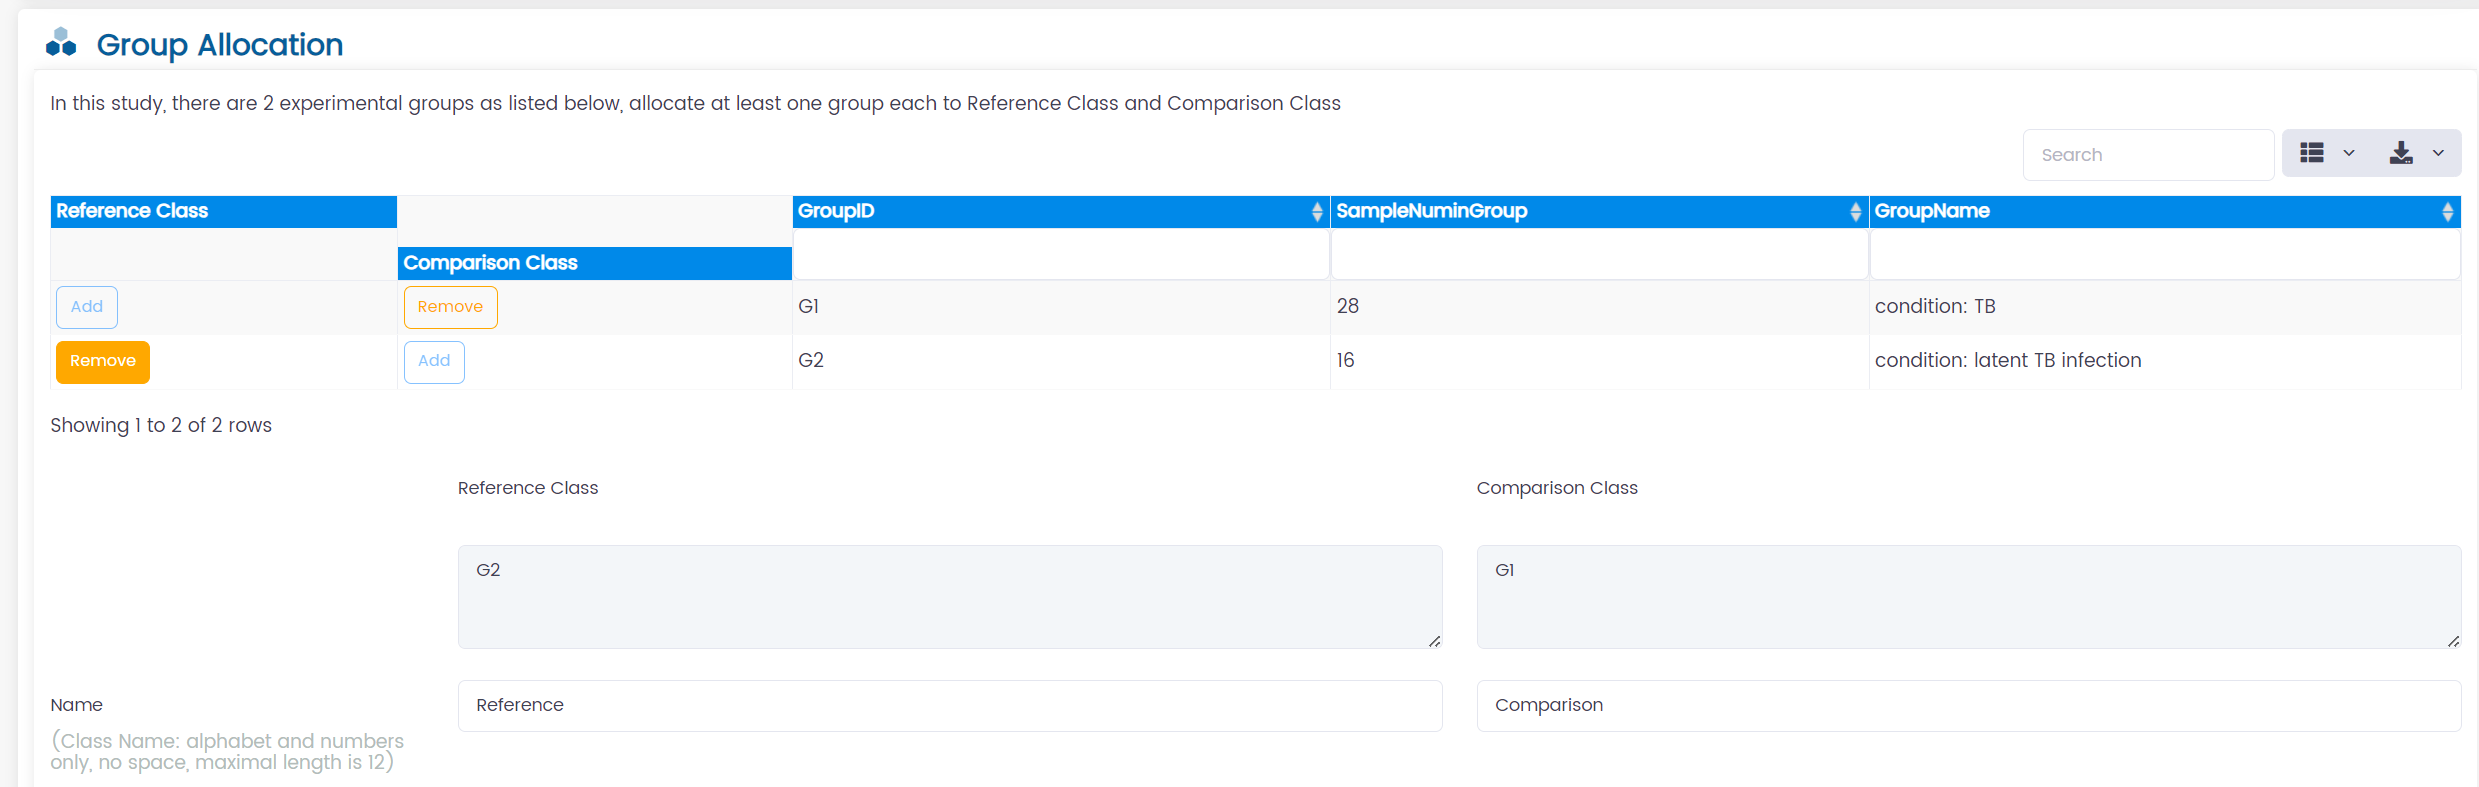
2. Allocation LTBI as the Reference Class and TB as the Comparison Class
3. Perform Data QC
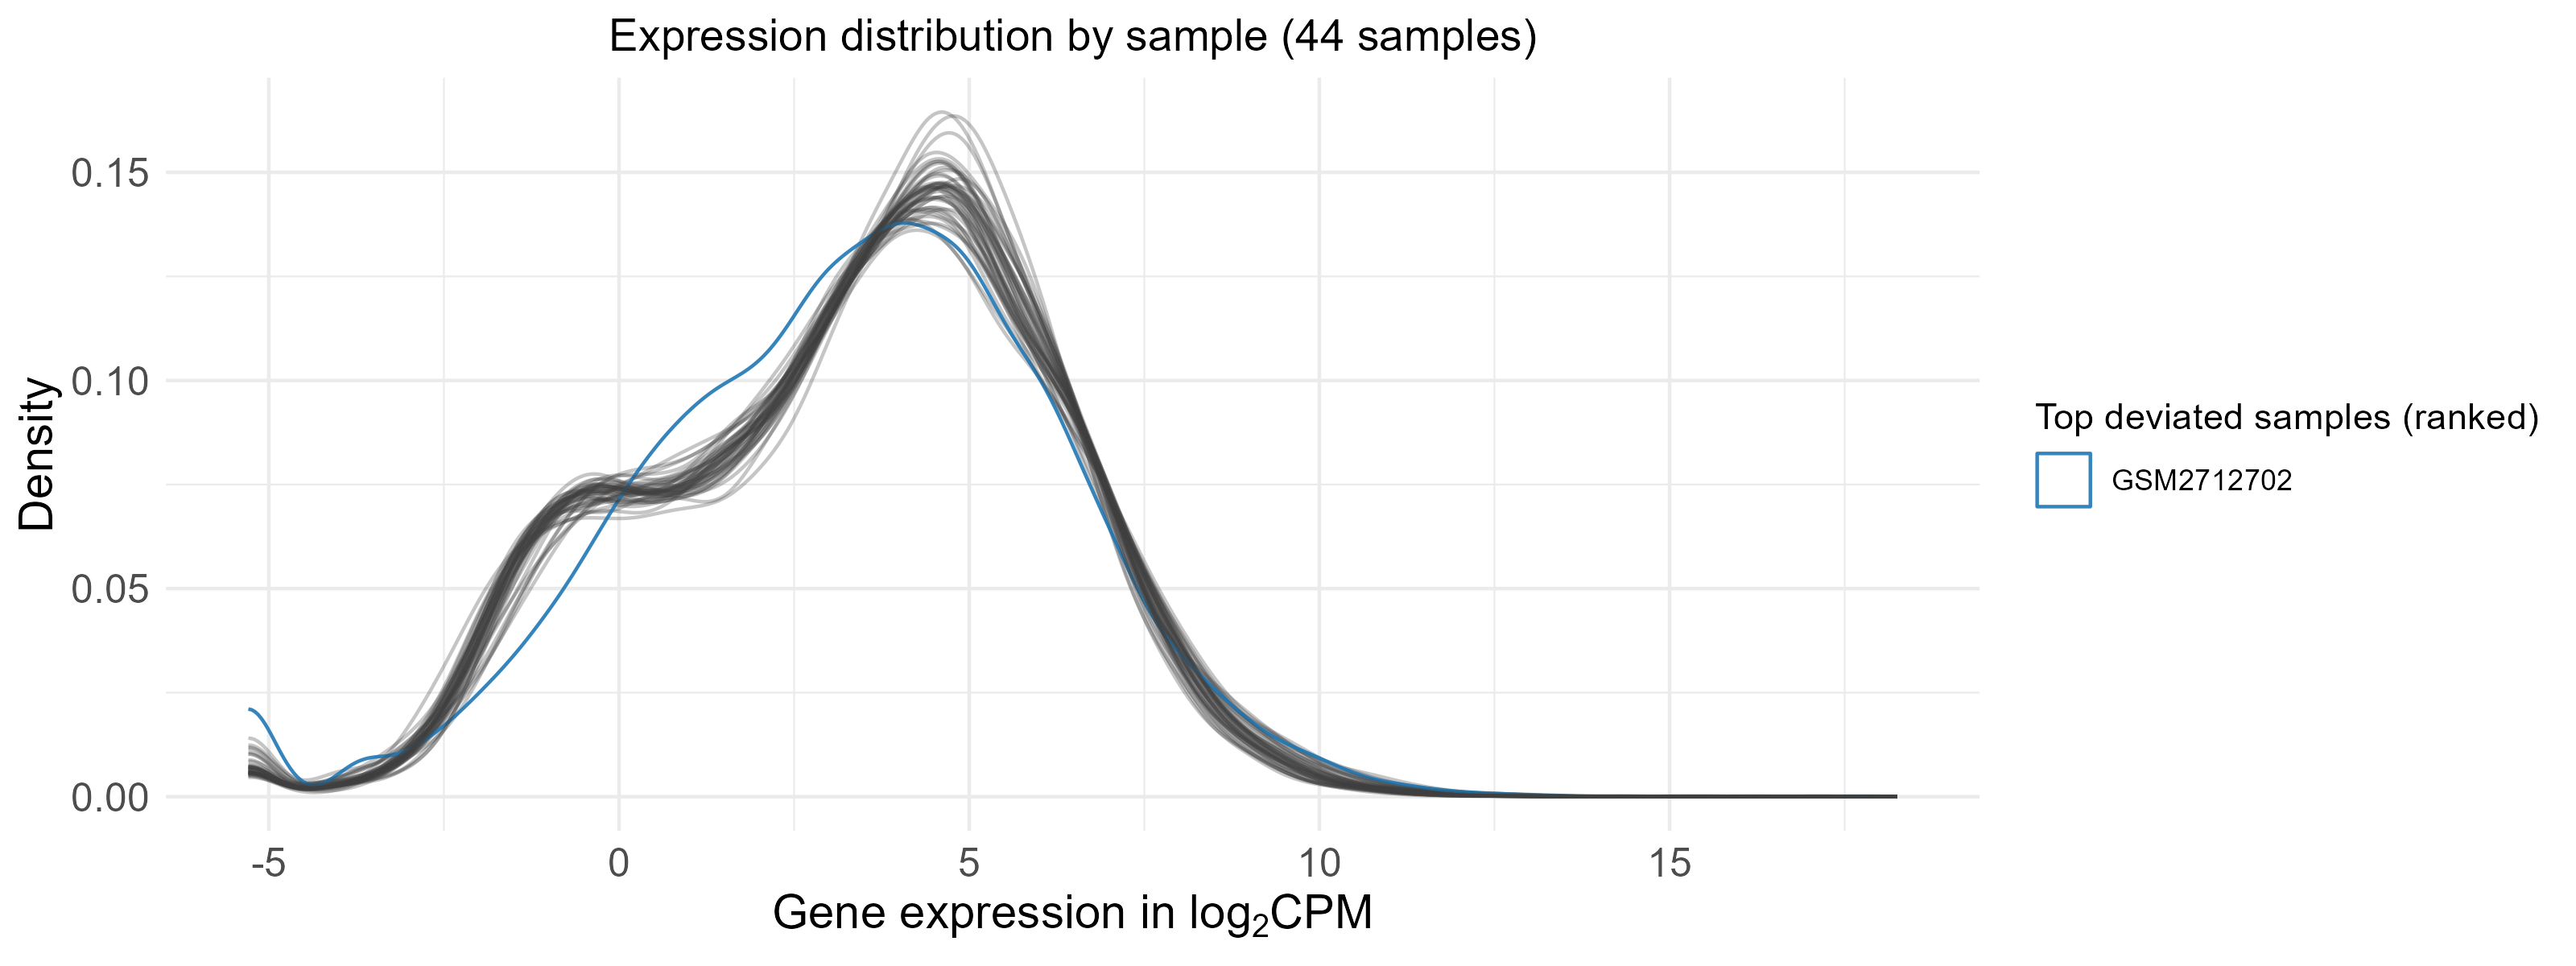
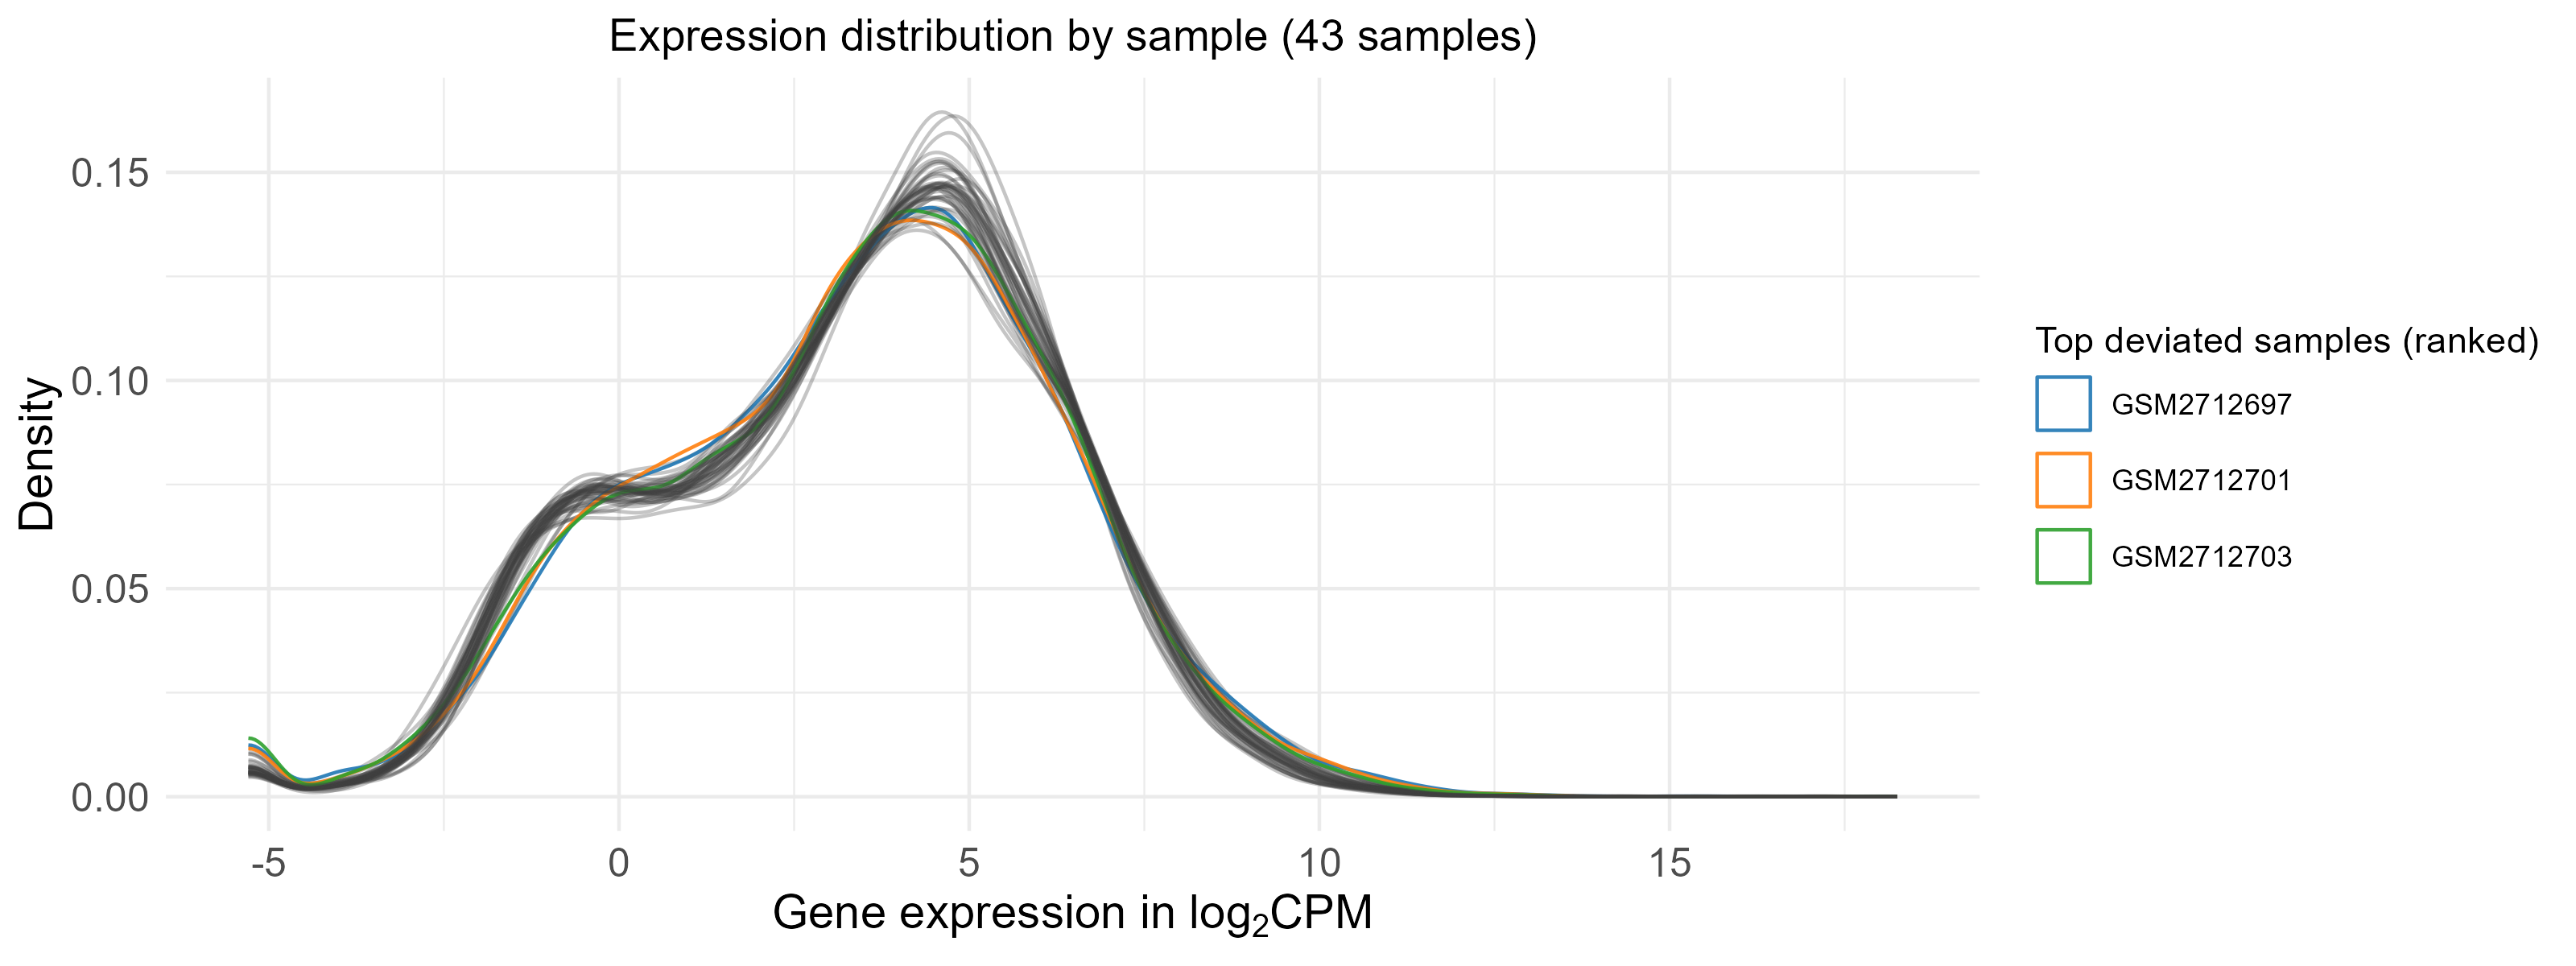
3.1 Outlier detection and removal
GSM2712702 is an outlier and is removed, the distributions of normalized expression are shown below before (44 samples) and after (43 samples) removing GSM2712702.
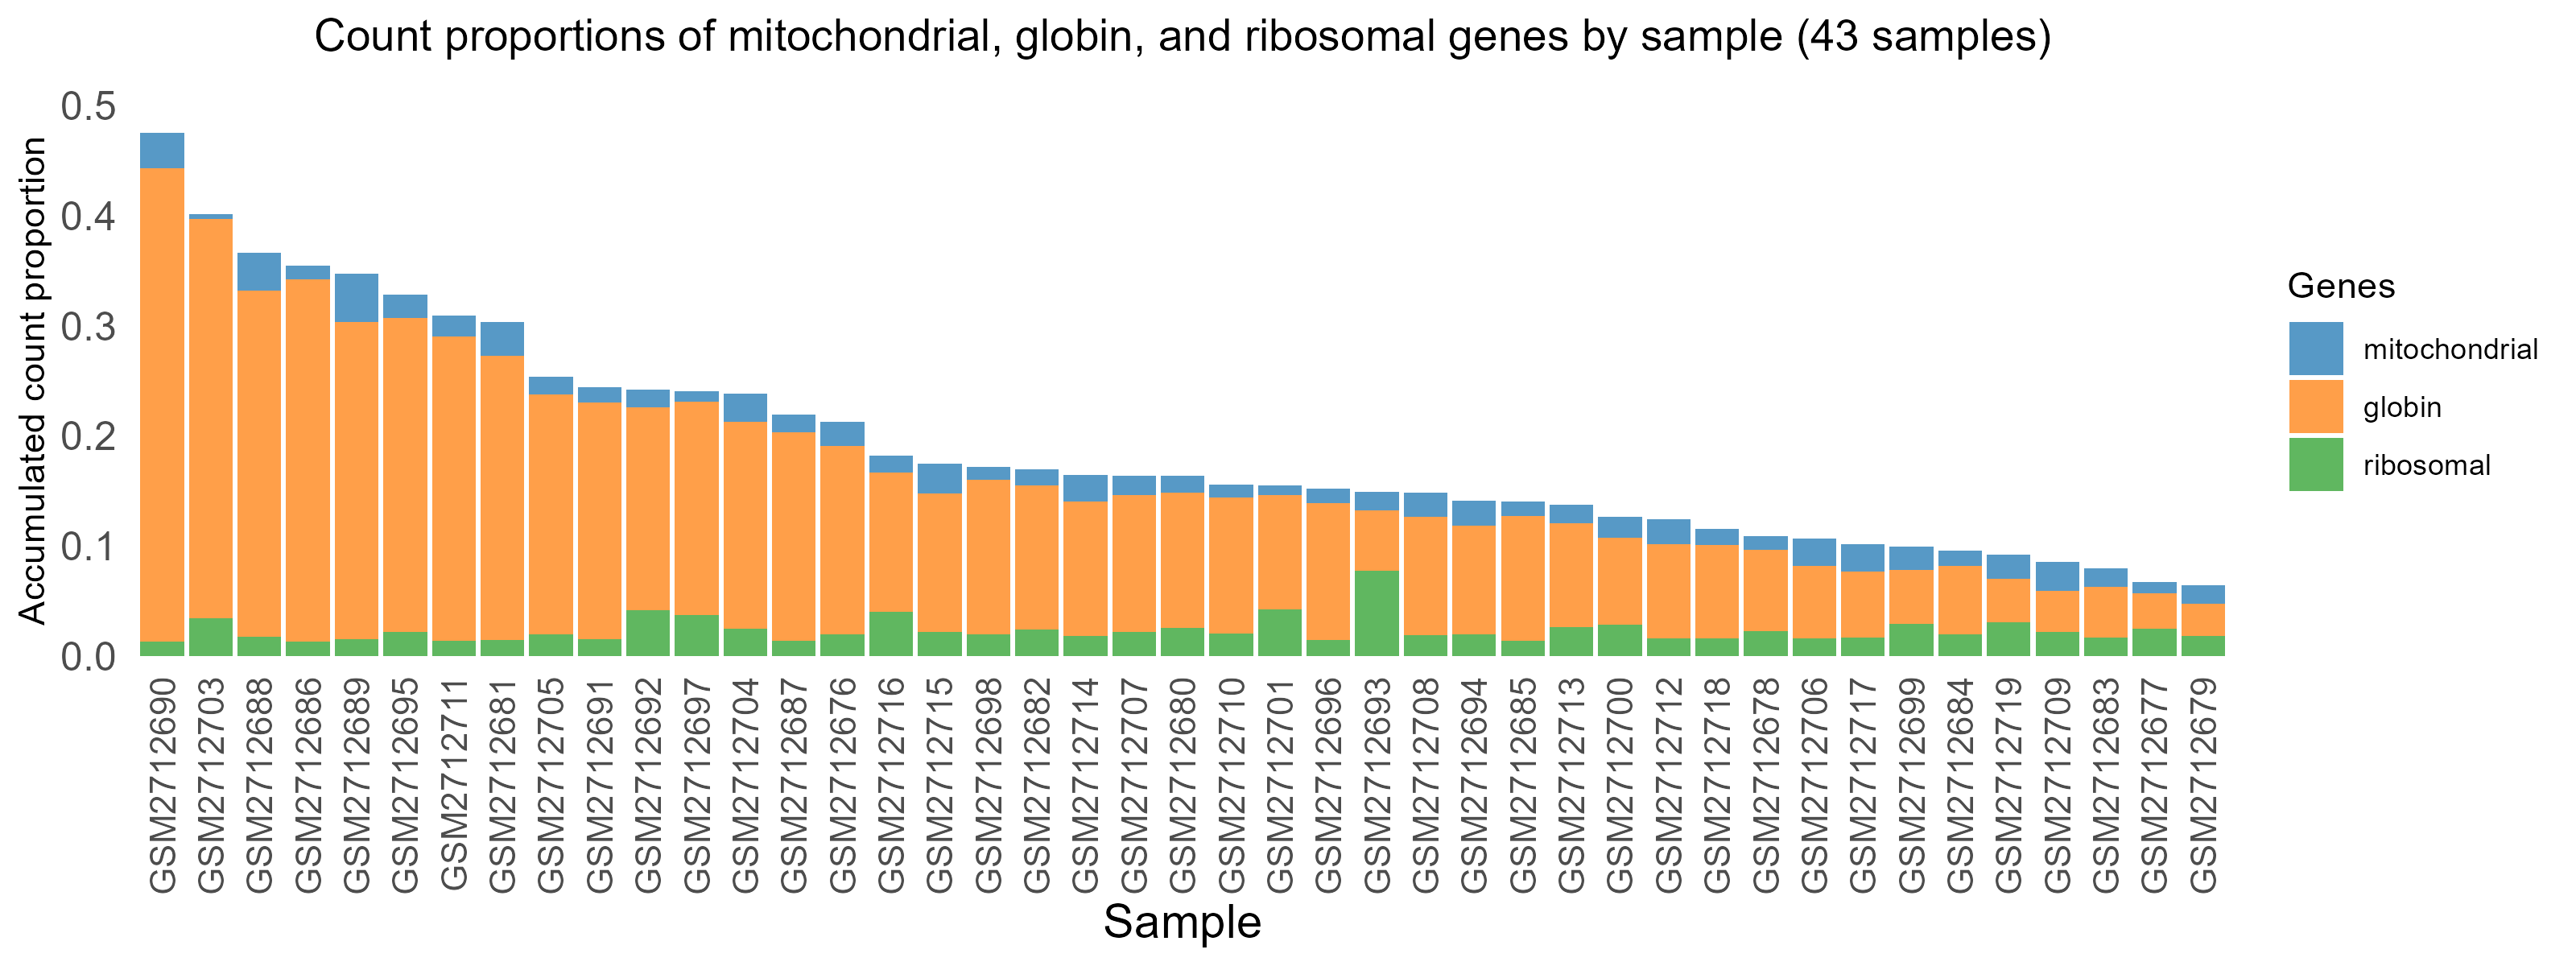
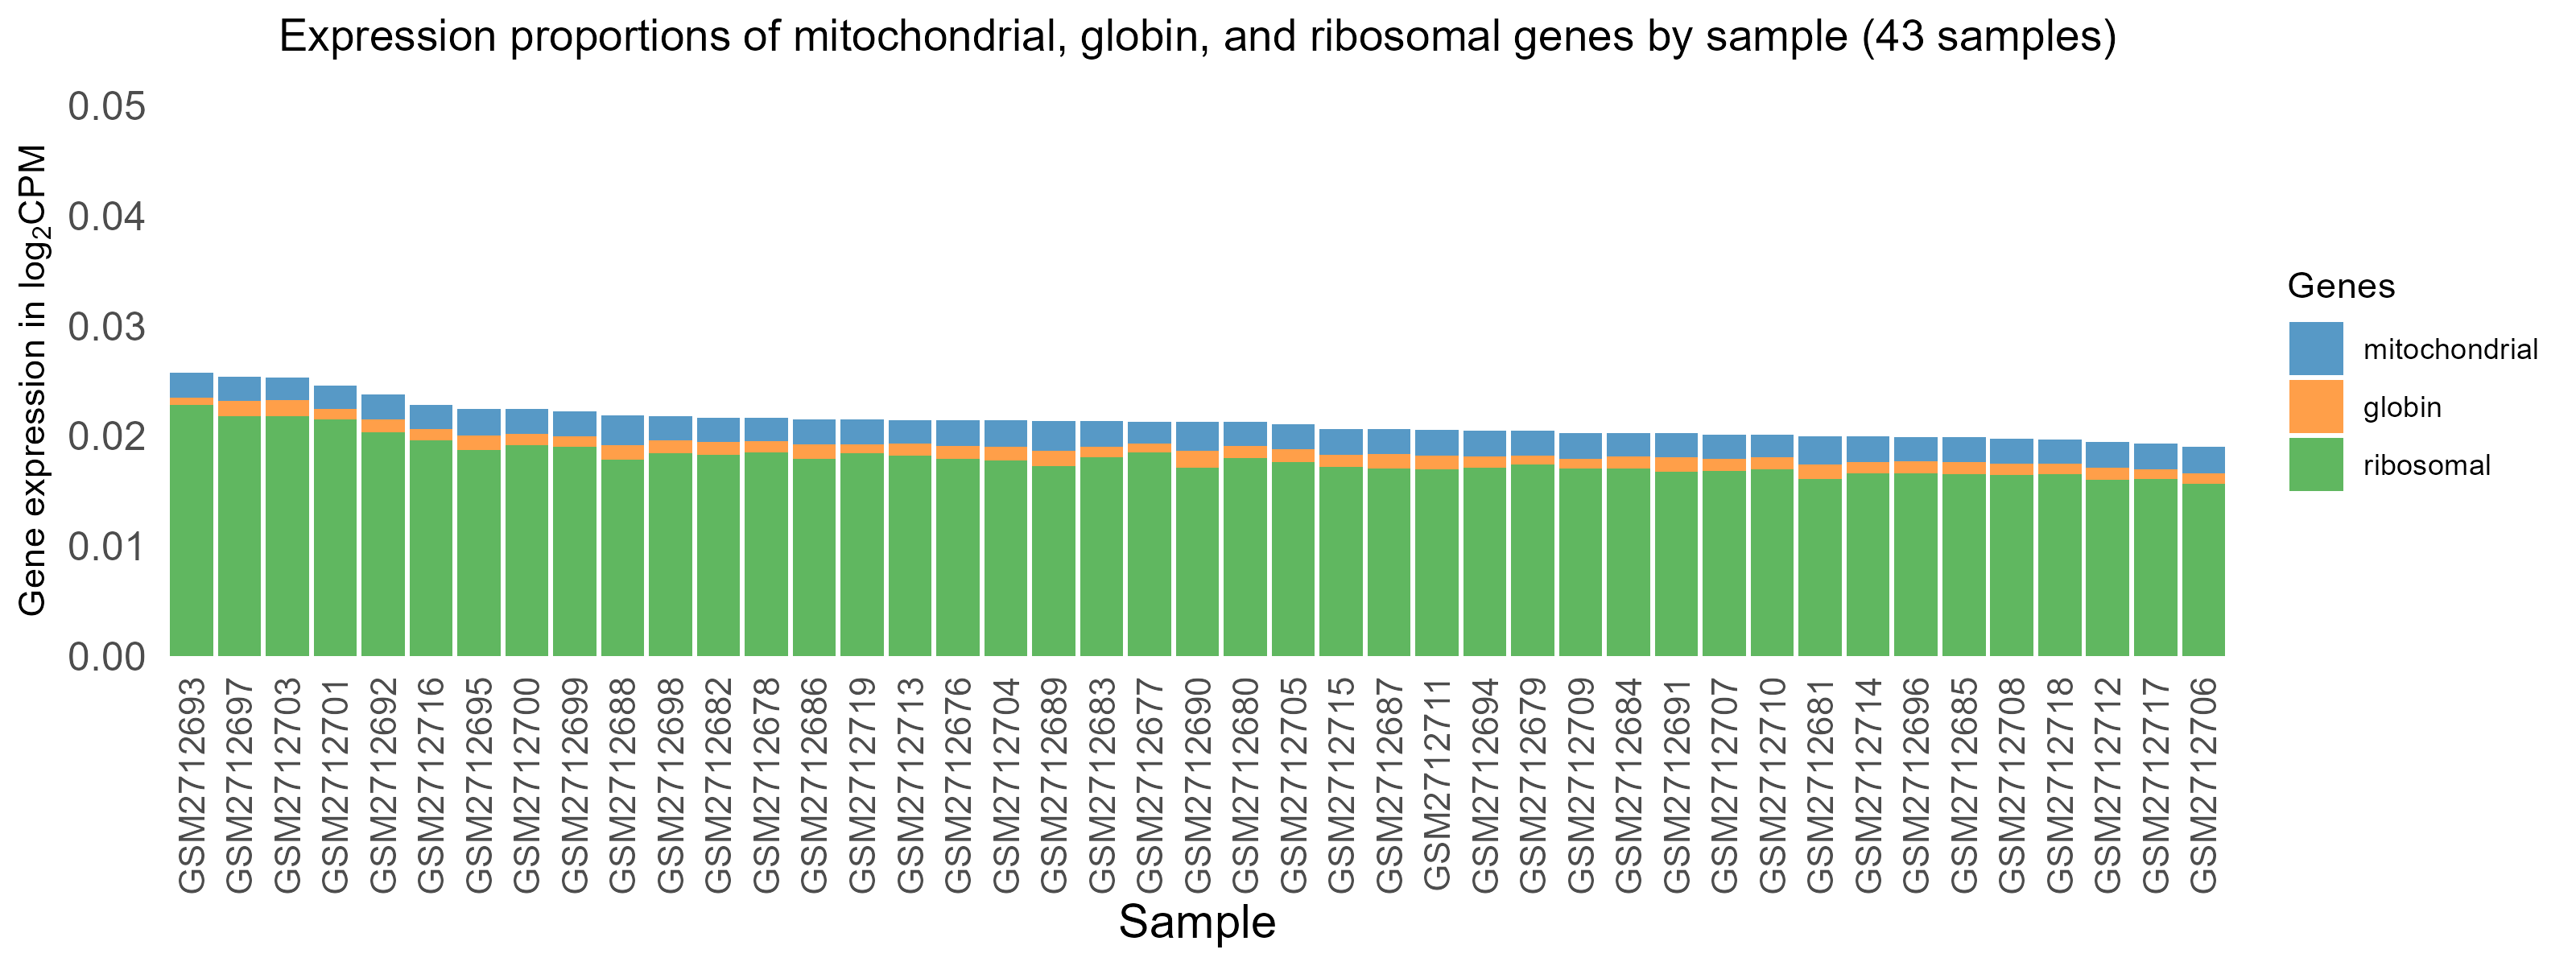
3.2 Globin gene expression and normalization
These are blood samples so there is significant expression proportion of globin genes (top) and expression normalization is mandatory to remove their squeezing impact on expression of other genes, without which, other genes appear low as an artifact.
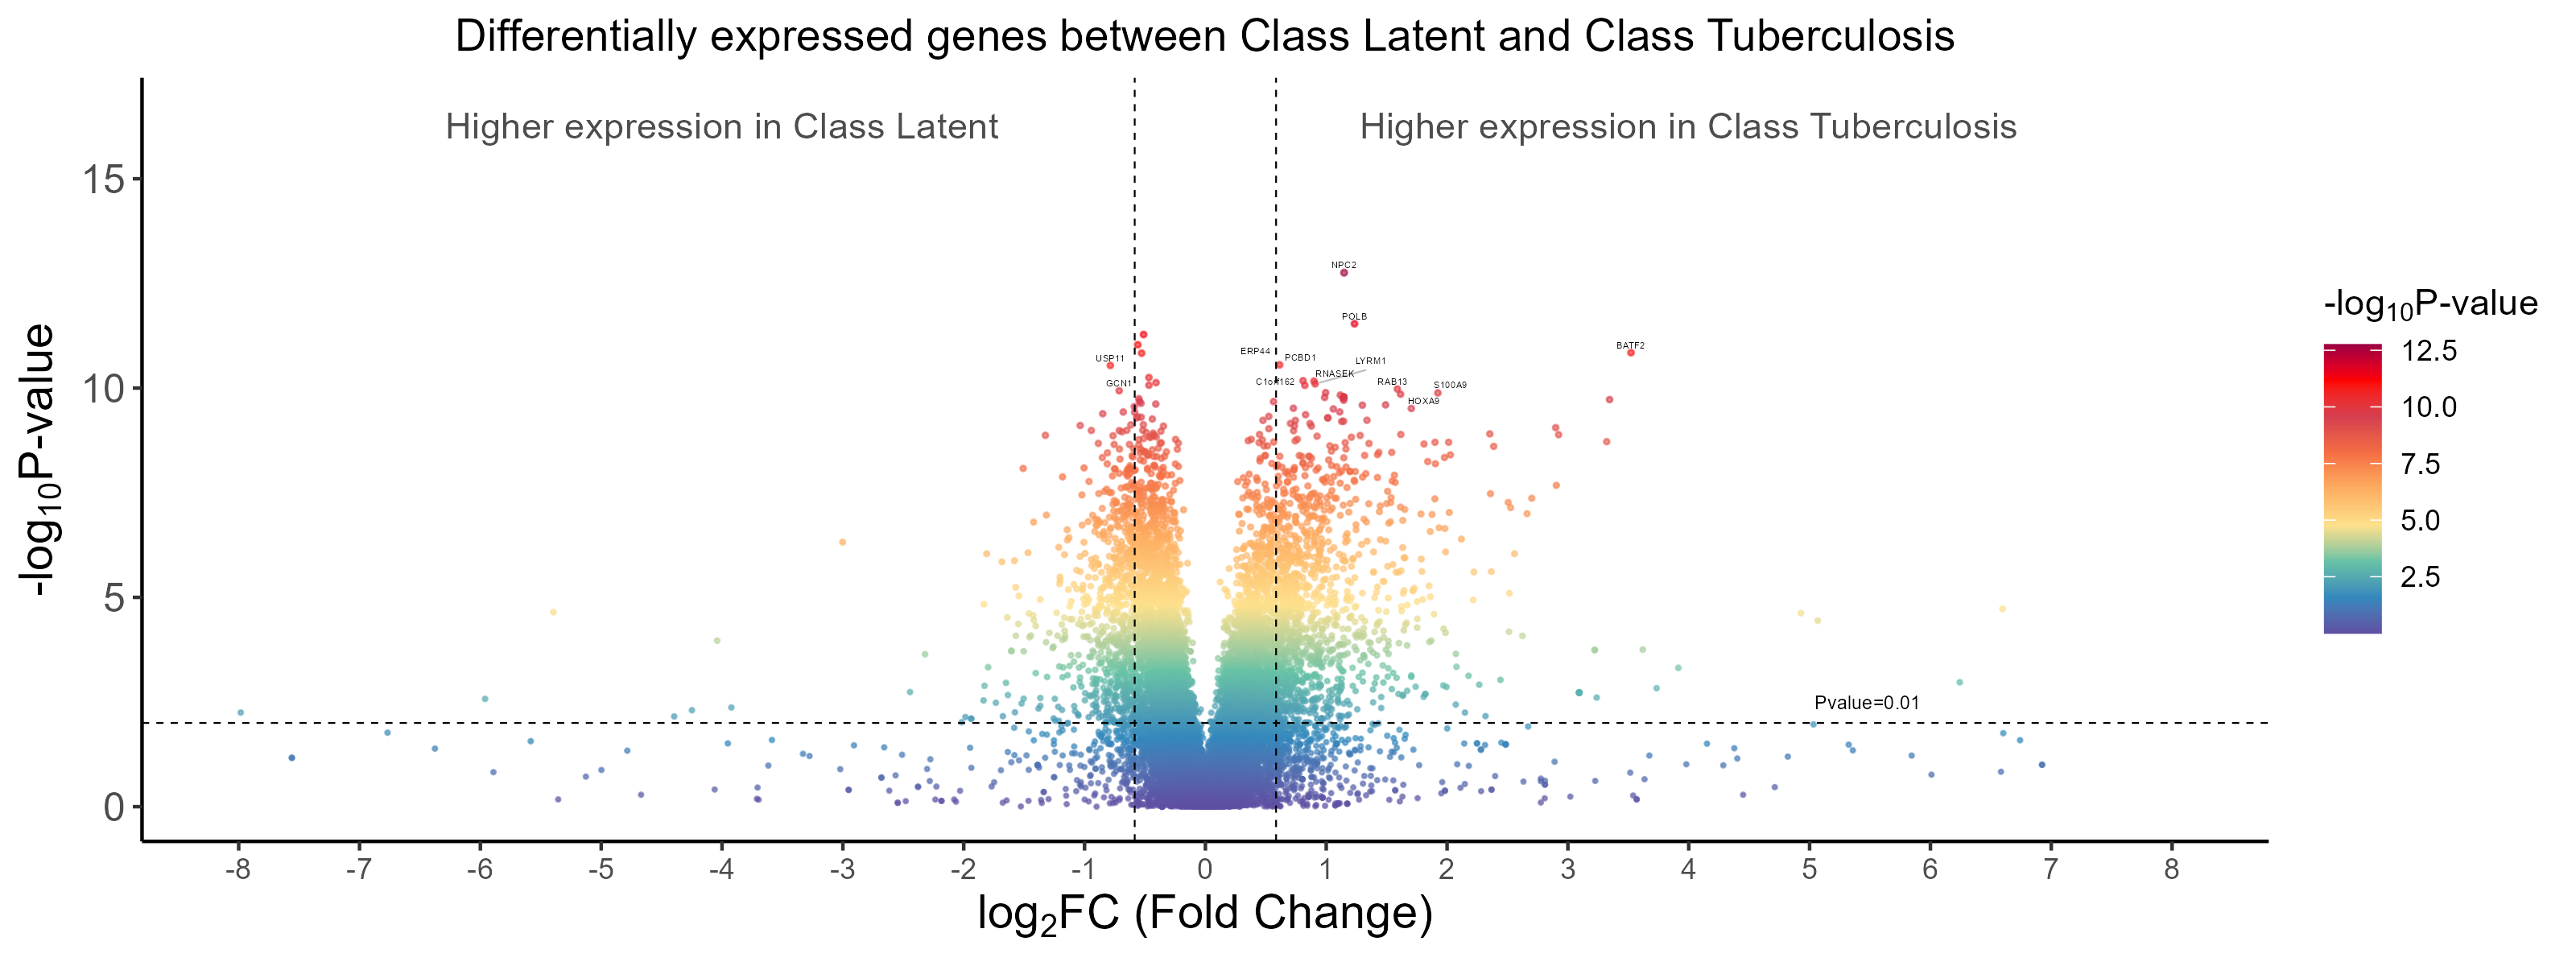
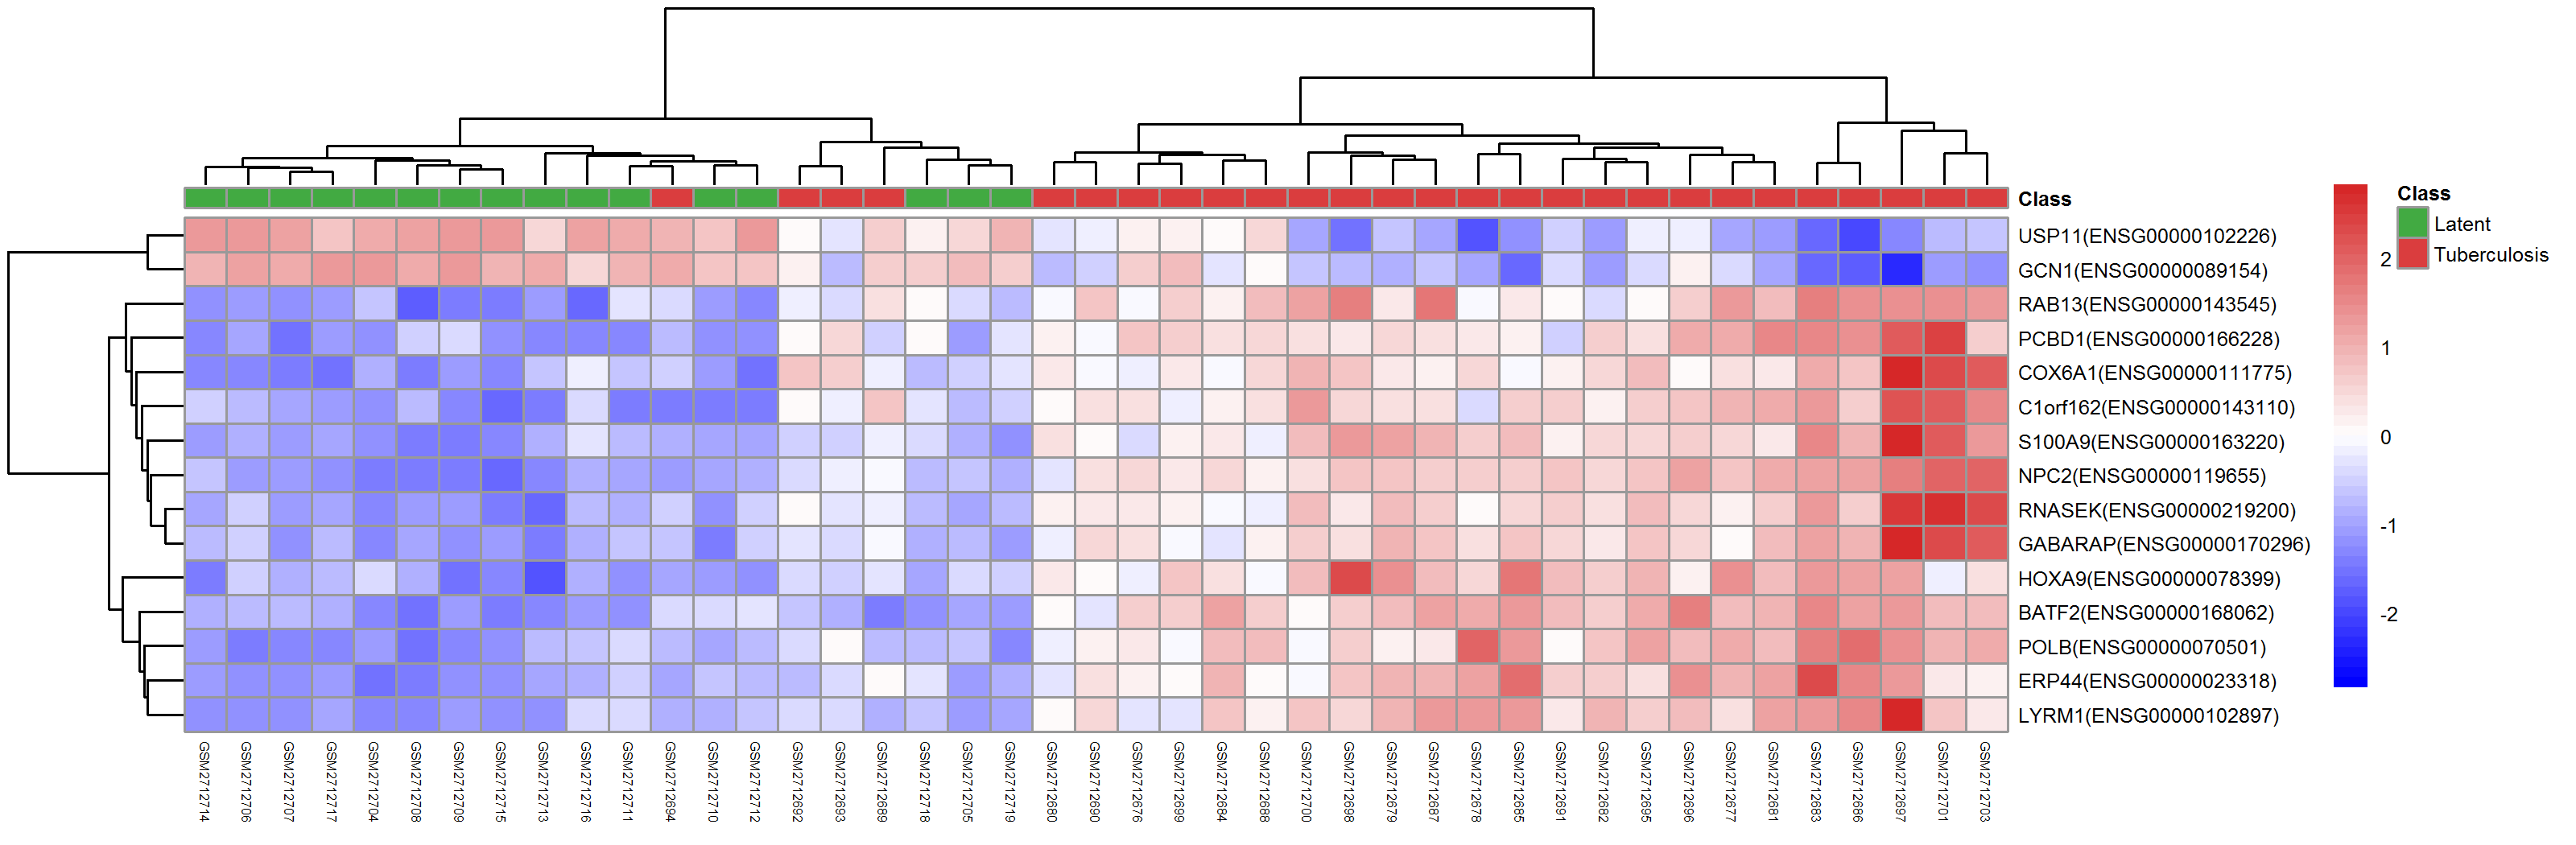
4. Differentially expressed genes (DEGs) and sample clustering
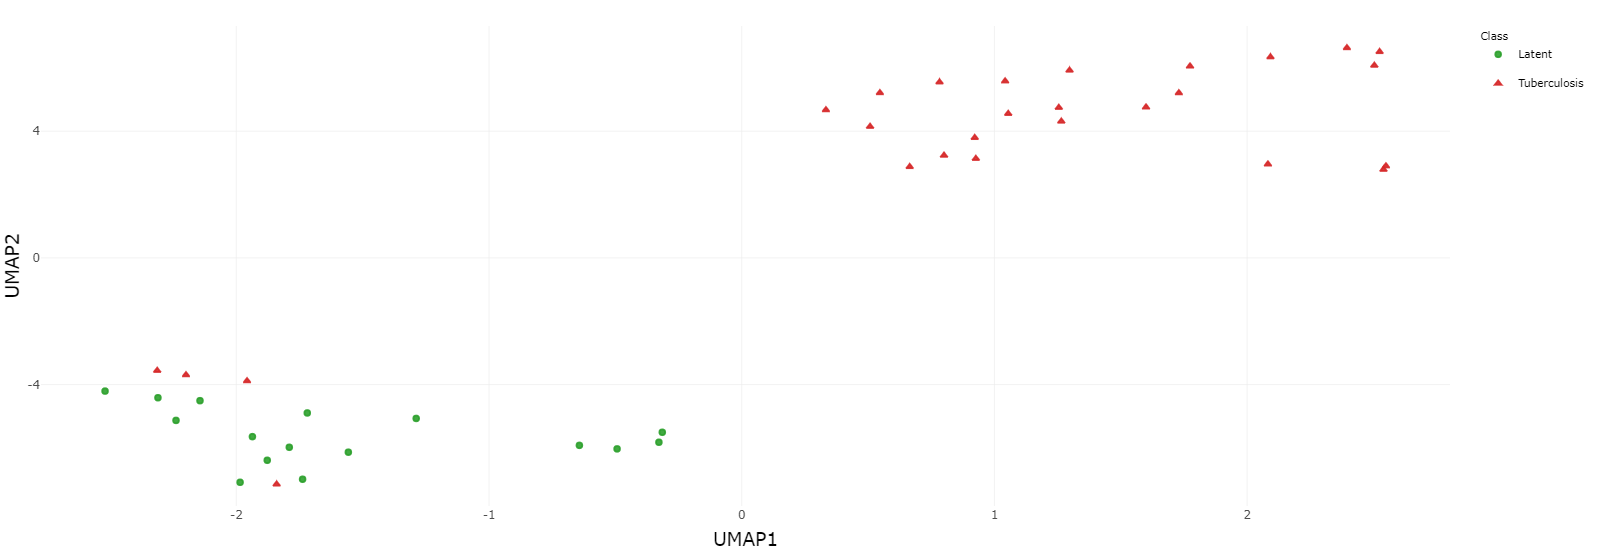
Many DEGs are identified and shown in the volcano graph (top), and we observe from both the heatmap (middle) and UMAP clustering (bottom) that TB and LTBI samples can be well separated except for four TB samples.
5. Data interpretation for biological insights
5.1 Enrichment Analysis
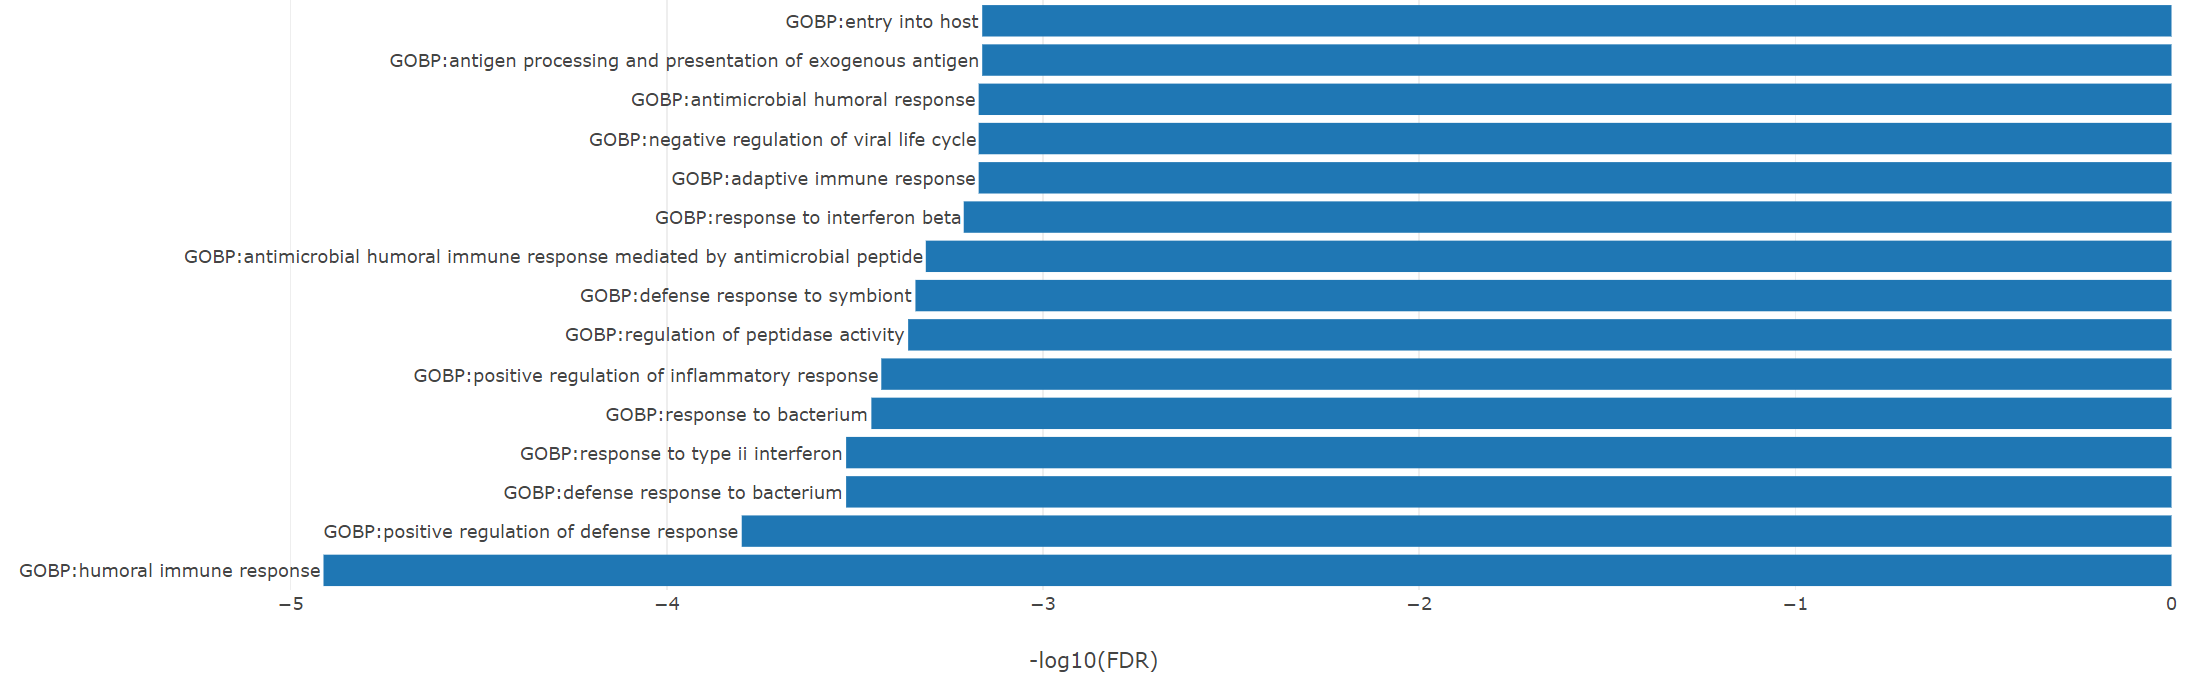
The top enriched GO-BP (Biological Process) terms are immune related, for example, Humoral Immune Response and Defense Response to Bacterium, all reflecting the underlying mechanism of tuberculosis affection and defense.
5.2 Pathway Analysis
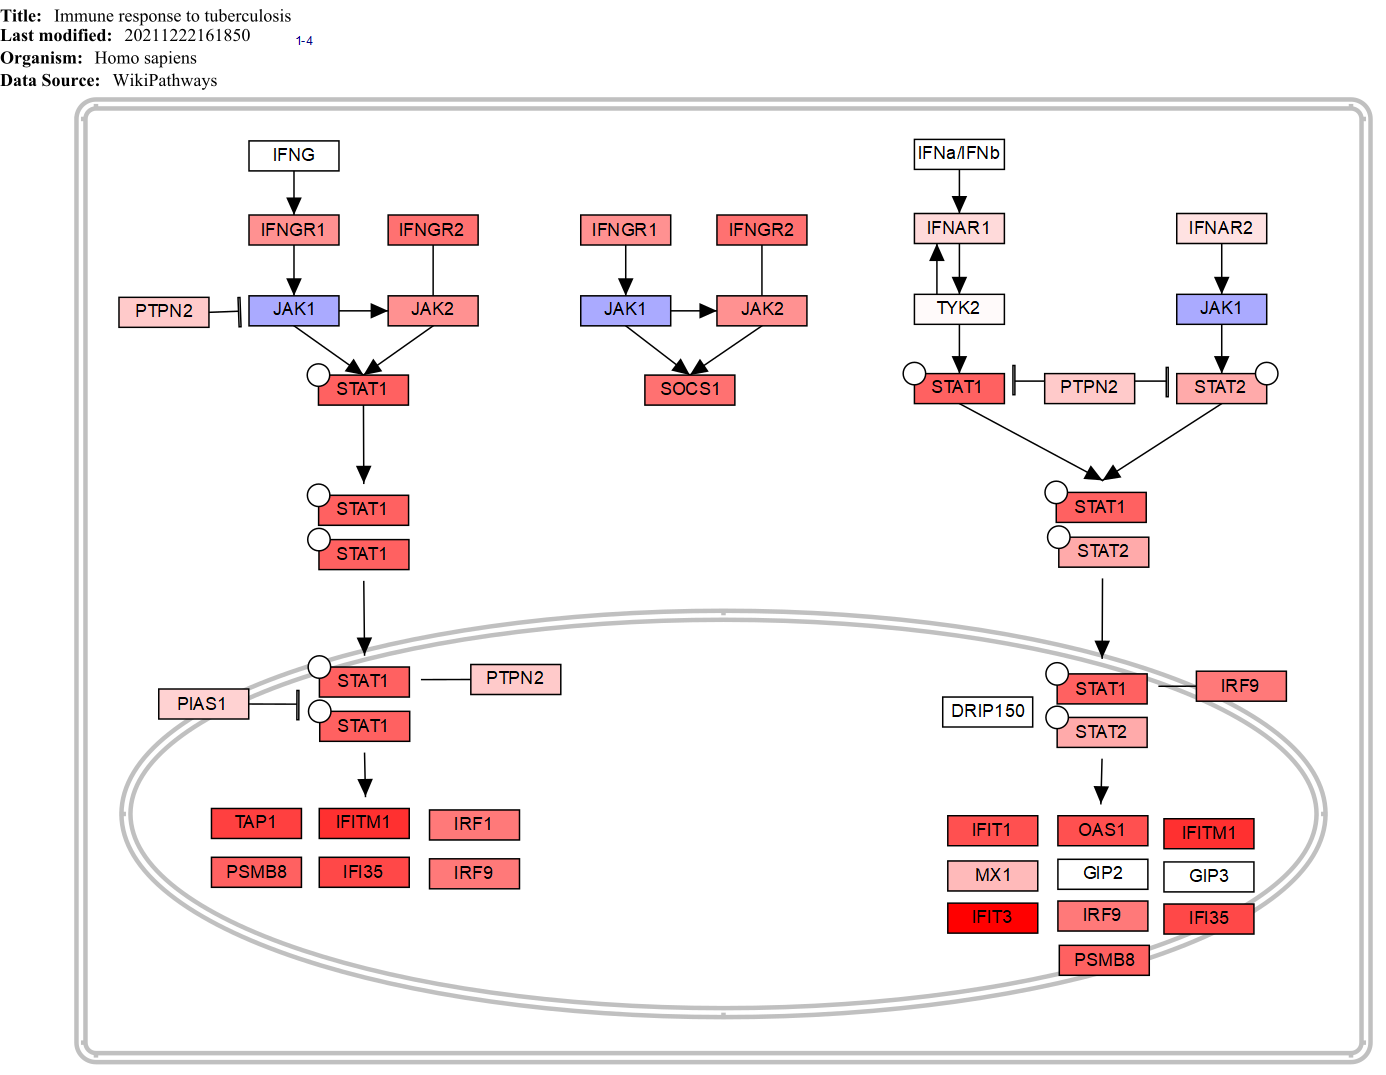
WikiPathways Immune response to tuberculosis is one of the top altered pathways identified and is more active in TB.
CONCLUSIONS
Enrichment and pathway analyses of tuberculosis (TB)-associated genes highlight significant immune-related biological processes and pathways. The top enriched Gene Ontology-Biological Process (GO-BP) terms include Humoral Immune Response and Defense Response to Bacterium, indicating active immune mechanisms during TB infection. Additionally, WikiPathways Immune Response to Tuberculosis emerges as a key altered pathway, showing heightened activity in TB. These findings underscore the critical role of immune system activation in host defense against Mycobacterium tuberculosis, providing valuable insights for potential diagnostic markers and therapeutic targets.
